
Sales forecasting uses historical performance, pipeline data, and buyer insights to predict future sales. The four main sales forecasting techniques are historical, weighted pipeline, bottom-up, and funnel forecasting. Together, they help businesses estimate which deals will close, when, and how much revenue to expect.
Predicting future sales sounds simple on paper.
You look at what's in your pipeline, estimate which deals will close, and add up the numbers.
But sometimes (ok, a lot of times) deals get delayed and budgets change.
Because you’re never going to be able to 100% prevent all of that, the trick is knowing how to account for it without just guessing.
In this guide, we'll break down how to forecast sales, which techniques work best, and how to use real data and buyer behavior to build forecasts you can trust.
Key Takeaways
- Four main sales forecasting techniques: Historical, weighted pipeline, bottom-up, and funnel forecasting. Each serves a different purpose.
- The best forecasts combine multiple methods: Historical data gives you a starting point, while reviewing individual deals helps you see whether your pipeline can deliver.
- Timing can make or break a forecast: A deal might eventually close, but that doesn't mean it'll close this quarter or start generating revenue right away.
- Forecasting gets better with practice: Comparing your predictions with actual results helps you improve accuracy over time.
What is Sales Forecasting?
Sales forecasting is an estimate of how much revenue your business will bring in over a set period, usually a month or a quarter. Teams build it from past sales results and the deals currently open, then adjust for how often deals like those have closed before.
A good forecast covers when a deal will close and when the money will show up, because those two dates can be far apart. A customer might be fully ready to buy, but if legal pushes the signature into next quarter, the revenue lands later than you planned.
Why Is Sales Forecasting Important?
A forecast lets you plan around the revenue you’ll realistically get instead of the revenue you’re just hoping for. And getting that number right isn't getting any easier as 69% of sales-operations leaders say forecasting is harder than it was three years ago.
A good forecast also gives you an early warning when something’s off. You’d much rather learn that now than on the last day of the quarter.
What’s the Difference Between a Sales Forecast and a Sales Target?
A target is what you want to hit, while a forecast is what your pipeline and win rates say you’ll probably hit.
It’s an easy mistake to keep nudging the forecast up to match the target, but keeping the two separate is what makes the forecast useful, since the target is where you’re aiming and the forecast is where you’re headed if nothing changes.
What Are the Four Main Sales Forecasting Techniques?
The four main sales forecasting techniques are:
- historical
- weighted pipeline
- bottom-up
- funnel-based
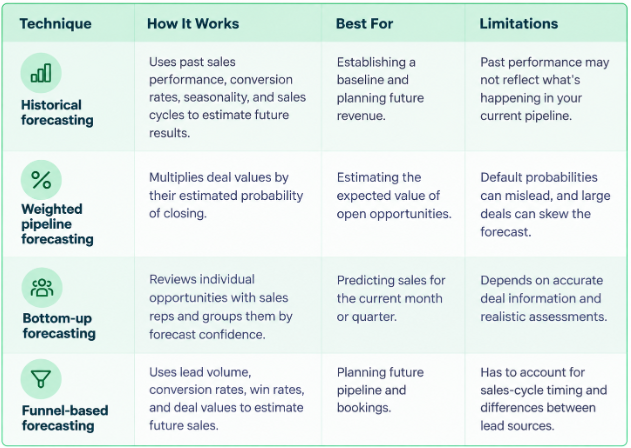
Historical and funnel forecasting work well for planning ahead, while weighted pipeline and bottom-up forecasting give you a better view of what your current opportunities will probably deliver.
1. What Is Historical Sales Forecasting?
Historical sales forecasting uses past performance to estimate what a business will sell in the future. If you know how your sales team has done before, you at least have a starting point for what comes next.
How Does Historical Sales Forecasting Work?
It looks at patterns in your previous results to set expectations for an upcoming period. The data that tends to help most includes:
- Past sales performance: Results by month or quarter
- Conversion rates: From lead or opportunity to customer
- Seasonality: Times of year when sales trend to be stronger or weaker
- Sales-cycle length: How long an opportunity usually takes to become a customer
You can also break the numbers down by lead source or service line, which matters because different types of opportunities often have very different win rates and sales cycles.
How Do You Calculate a Historical Sales Forecast?
One simple approach is to average your sales over comparable periods.
When Should You Use Historical Sales Forecasting?
It works best when you need a baseline for revenue planning, since it shows what your business has typically been able to generate and whether your current expectations are reasonable. What it can’t do is tell you whether the deals in your pipeline will close, so it pairs best with techniques that look at current opportunities and buyer activity.
2. What Is Weighted Pipeline Forecasting?
Weighted pipeline forecasting estimates future sales by multiplying the value of each open opportunity by its probability of closing. Instead of assuming every deal in your pipeline will close, you give each one a percentage based on how likely it is to become a customer, which gives you the expected value of your current pipeline.
How Does Weighted Pipeline Forecasting Work?
If you have a $50,000 opportunity with a 60% chance of closing, you wouldn’t count the full $50,000 toward your forecast. You’d count $30,000, then repeat that for every opportunity and add up the results.
The tricky part is where the probabilities come from. Some teams use default percentages tied to deal stages, which is fine as a starting point but shouldn’t replace a real look at the opportunity.
What Is the Weighted Pipeline Forecasting Formula?
To get the total, add up the weighted values of all the relevant opportunities.
What Are the Limitations of Weighted Pipeline Forecasting?
A probability is only as good as the evidence behind it, so if your CRM automatically assigns 80% to every deal in negotiation, that doesn’t mean each of those deals has an 80% shot.
Weighted forecasts can also hide how much you’re leaning on one big opportunity. Running scenarios with and without your biggest deals is better than relying on a single weighted number.
Weighted forecasting also says nothing about when a deal will close or when the revenue will start, so you’ll need to answer those questions separately.
3. What Is Bottom-Up Sales Forecasting?
Bottom-up forecasting starts with individual opportunities instead of a revenue target or a historical average. Sales managers go through deals with their reps, judge how likely each one is to close, and roll those judgments up into a broader forecast.
How Does Bottom-Up Forecasting Work?
It means reviewing each deal and deciding how much confidence the team should have in it, which takes more than looking at the amount and the CRM stage. For each opportunity, the team should know whether the buyer is likely to move forward and whether the deal can realistically close within the forecast period. They should also know which approvals or decisions are still outstanding, what could delay or kill the purchase, and who owns the next action and by when.
What Are the Main Sales Forecast Categories?
The most common categories are:
- Commit: Opportunities the team has strong evidence will close within the forecast period
- Most Likely: Opportunities expected to close, but with some uncertainty remaining
- Best Case: Opportunities that could close within the period if remaining conditions work out
A category isn’t proof that a deal will close. A rep might feel great about a deal because the buyer has been enthusiastic from day one, but if that buyer still needs budget approval and a legal review, plus a signature from someone who hasn’t been involved yet, plenty can still go sideways.
When Should You Use Bottom-Up Sales Forecasting?
It’s most valuable when you’re predicting sales for the current month or quarter. At that point historical averages won’t cut it, and you need to know which specific deals can realistically close before the period ends. It also gives managers a chance to spot risks and work with reps on what could move a deal forward.
4. What Is Funnel-Based Sales Forecasting?
Funnel-based forecasting estimates future bookings by looking at how leads move through your sales process and how many end up as customers. Rather than starting with existing deals, it works backward from lead volume, conversion rates, win rates, and average deal value. That makes it especially good for figuring out whether you’re generating enough future pipeline to support your sales goals.
How Does Funnel-Based Sales Forecasting Work?
It follows the path from lead generation to closed-won business.
- Lead Generation: How many potential customers enter your funnel
- Qualification: Counts the leads that meet your criteria for becoming opportunities
- Opportunity Creation: Tracks how many of those turn into actual deals
- Closed-won: Tells you how many of those deals become customers
Apply your historical conversion rates at each stage and you can estimate how much business your current lead volume could eventually produce. Not every lead deserves equal treatment, though. A partner referral may qualify at a different rate, win at a different rate, or take longer to close than a marketing-generated inquiry, and using one conversion rate across every source makes your forecast look more precise than it really is.
What Is the Funnel-Based Sales Forecasting Formula?
If your average sales cycle runs several months, leads that show up near the end of the quarter may not become customers until the next quarter or later, so funnel forecasting has to account for timing as well as conversion rates.
You also need consistent qualification definitions and a way to avoid double counting. Once a lead becomes an opportunity, it shouldn’t show up in the same forecast as both a lead-based projection and a separate opportunity.
When Should You Use Funnel-Based Sales Forecasting?
It’s best for longer-term revenue planning, since it shows whether your lead generation and qualification efforts are producing enough opportunities to support future sales. It can also get Marketing and Sales working from the same assumptions about lead quality, conversion rates, and expected pipeline.
For near-term forecasting, funnel projections are less concrete than reviewing real qualified opportunities. That’s why funnel forecasting works best next to historical performance and deal-level forecasting instead of replacing them.
How to Forecast Sales Step by Step
You need a consistent process for checking your data against your pipeline and deciding which deals will likely close.
Here’s a good plan:
Step 1. Define Your Forecast Period and Revenue Metric
Decide whether you’re forecasting the next month, the next quarter, or something longer, and agree on which revenue metric you’re measuring.
The three common options are:
- Bookings: The value of deals customers have committed to in signed agreements
- Recurring revenue: What you expect from ongoing agreements after upgrades, downgrades, and churn
- Recognized revenue: Revenue recorded as it's earned, which can happen after a deal is signed
These numbers can’t be swapped for each other. A customer might sign a $60,000 annual agreement in March but not start receiving services until April, so that deal counts toward March bookings and adds nothing to March recognized revenue.
And when teams aren't on the same page, forecasts suffer as three in 10 leaders attribute missed forecasts to weak collaboration between teams. Make sure everyone is forecasting the same thing, because otherwise you’ll end up with several numbers that are all technically correct and answer totally different questions.
Step 2. Analyze Historical Sales Performance
Next, look at how your team has done in the past. History gives you a baseline for what you can reasonably expect, which beats picking a revenue goal and working backward to justify it.
The metrics worth pulling are win rates, conversion rates at each stage, average deal size, and sales-cycle length. And those numbers can vary quite a bit depending on how your team operates. In one benchmark analysis, teams applying RevOps best practices reported 87% higher win rates and 21% shorter sales cycles.
Step 3. Review Your Current Sales Pipeline
Now check whether your current pipeline backs up what the historical numbers suggest. Go through your open opportunities and look for anything that could move your forecast.
Start with whether enough new deals are entering the pipeline to support future sales, then look at where deals sit by stage and how long they’ve been sitting there. Watch for repeatedly pushed close dates and forecast categories that no longer match what's happening with the buyer.
If half your forecast depends on two opportunities, you want to know that before either one slips. And don’t assume a deal will close just because it reached a late stage. A deal can be in negotiation while the buyer is still working through approvals or hasn’t committed to a timeline. Your pipeline should tell you how realistic your revenue is, on top of how much of it is sitting in the CRM.
Learn how to spot gaps in your pipeline, diagnose revenue problems, and figure out what to fix with our RevOps 201 course 👇
.png?width=1600&height=800&name=image%20(1).png)
Step 4. Evaluate Buyer Evidence and Deal Timing
This is where you separate the deals that look promising from the ones with a real shot at closing.
For every significant opportunity, ask these questions.
- Are we likely to win the deal?
- Are we likely to win within the forecast period?
- If we win, when will the engagement start generating revenue?
Base your answers on what the buyer has confirmed, not just what your sales team expects.
Step 5. Apply the Right Sales Forecasting Techniques
With your history and pipeline reviewed, you can start putting numbers together. Instead of leaning on one method, combine several so you get a fuller picture.
Historical forecasting sets your baseline from past performance and sales-cycle trends. Weighted pipeline forecasting values your open opportunities by how likely they are to close, and bottom-up forecasting uses deal reviews and forecast categories to judge what can realistically land. Funnel forecasting rounds it out by projecting future bookings from lead volume, conversion rates, win rates, and average deal size.
Step 6. Build Multiple Sales Forecast Scenarios
Calculate a few outcomes instead of betting on one number. A best case shows what happens if your larger opportunities close inside the period. A most likely case reflects what the buyer evidence actually supports, and a worst case shows what happens if important deals slip.
A single weighted forecast can mislead you. It accounts for the probability of a deal closing without showing how much your results hang on that one deal. So show people the number along with what could change it and by how much.
Step 7. Compare Your Forecast With Actual Results
When the forecast period ends, go back and compare what you predicted with what happened. See how close you got to the final result, which deals closed as expected, and which ones slid into another period. Check whether certain forecast categories ran too optimistic, and whether your closing probabilities matched real outcomes.
How Do You Calculate Sales Forecast Accuracy?
One way to measure forecast accuracy is to compare your predicted sales against your actual results using this formula:
Look for patterns instead of treating each miss as a one-off. Forecasting gets more accurate when you learn from your previous calls.
Which Sales Forecasting Technique Is Most Accurate?
No single sales forecasting technique is the most accurate in every situation. And accuracy is something most sales teams struggle with as only 7% of sales teams achieve forecast accuracy of 90% or more.
Combining historical performance with deal-level buyer evidence generally provides a more reliable forecast than relying on one method alone.
How Do You Evaluate Individual Opportunities in a Sales Forecast?
A reliable forecast needs three separate answers for each opportunity.
1. Are We Likely to Win the Deal?
Look at whether the buyer has confirmed budget and whether you’re talking to someone with decision-making authority. There should also be a real business need behind the purchase. An enthusiastic buyer is a good sign, but enthusiasm doesn’t come with budget or sign-off, so judge the deal by what the buyer has done and give what they’ve said less weight.
2. Are We Likely to Win Within the Forecast Period?
Even when you’re confident a deal will close, the timing can be a different story. And with 57% of sales professionals saying the sales cycle is getting longer, predicting when a deal will close isn't getting any easier.
A buyer might be ready to move forward but still have legal reviews or budget approvals holding things up. That's why you need to confirm what's left before signature and whether those steps can realistically happen within your forecast period.
3. If We Win, When Will the Engagement Start Generating Revenue?
Closing a deal and earning revenue from it can happen at different times. Track the expected signature date, engagement start date, and when revenue will actually be earned. That way, your forecast reflects the revenue metric you're measuring instead of assuming everything happens when the contract is signed.
What Data Do You Need for Accurate Sales Forecasting?
Good forecasting starts with good data, but a CRM full of numbers doesn’t mean you have what you need. And adding AI to the equation doesn't change that as 84% of data and analytics leaders say AI output is only as good as its underlying data.
You still have to know how your business has performed, what’s happening in your pipeline right now, and whether buyers are moving toward a purchase.
That comes down to three kinds of data:
- Historical sales performance: What past results say about future sales
- Current pipeline health: What your open opportunities suggest you could close
- Buyer evidence: What buyers have confirmed about their intentions, decisions, and timelines
1. What Historical Sales Data Should You Track?
Historical data gives your forecast a baseline. It shows how your sales process has performed over time and gives you somewhere to start when estimating what’s next. These are the metrics worth watching.
- Win rates: Your win rate is the percentage of opportunities that become customers. A 2025 benchmark analysis found average B2B win rates around 20% to 21%, while top-performing teams reached 30% or more. That's a pretty big difference when you're trying to predict how much of your pipeline will actually close. Use your own historical win rates to build your forecast, since results can vary depending on where opportunities come from and what you're selling.
- Sales stage conversion rates: Stage conversion rates show how often opportunities move from one stage to the next, which tells you where deals usually progress and where they stall or drop out. For forecasting, this matters because a brand new opportunity shouldn’t carry the same expectations as one that’s deep into the buying process.
- Average deal size: Average deal size is what a typical closed-won opportunity is worth. Be careful with averages when your prices vary a lot though, since one unusually large deal can make the number less representative of your typical opportunity.
- Average sales-cycle length: Sales-cycle length is how long it usually takes an opportunity to become a customer, and it matters most when you’re predicting when revenue will arrive. If your cycle averages 90 days, opportunities created in the last month of a quarter will probably close in the next one.
- Performance by lead source or service line: Opportunities don’t all behave the same way. Breaking your history down by source or service line keeps you from applying one set of assumptions to everything. The closer your historical data matches the deals you’re forecasting, the more useful your baseline gets.
Metrics like average deal size and conversion rates are only useful if you can calculate them consistently. Our new BLUF software lets you build custom calculations using your CRM data, including metrics from different objects, so you can track the numbers that feed into your sales forecasts 👇
2. What Current Pipeline Metrics Should You Track?
Historical data tells you what happened before, and your current pipeline tells you what’s happening now. Total pipeline value isn’t enough on its own. You need to know whether the pipeline can deliver the revenue you’re expecting.
- New opportunity creation: Track how many new opportunities are entering your pipeline, since that shows whether you’re building enough potential business to support future sales. If creation slows down, future bookings can take a hit even while the current quarter still looks healthy.
- Deal stage aging: Stage aging is how long an opportunity has sat in the same stage. A deal that’s been in negotiation for several weeks deserves a closer look, especially without a clear next step. The longer a deal sits without real progress, the more you need to know what’s holding it up.
- Close-date changes: Track how often expected close dates get pushed back. Repeated changes can signal that your forecast is relying on unrealistic timelines, especially when there's little evidence of buyer progress.
- Sales forecast categories: Commit, Most Likely, and Best Case show how confident your team is in each opportunity, but they have to reflect current evidence. If a deal is marked Commit while it still needs budget approval, legal review, and a final decision, it’s fair to question whether that category is right.
- Next steps and follow-up commitments: Every significant opportunity should have a clear next action, and you should know who owns it and when it’s due. Specific commitments make it easier to tell whether a deal is heading toward a decision.
- Pipeline concentration in large deals: Check how much of your expected revenue depends on a small number of opportunities. If two deals make up most of your forecast, leadership needs to know what happens when one slips. Total pipeline value won’t show you that, so you have to look at where the risk is piled up.
3. What Buyer Evidence Should You Track?
Your CRM might show a deal in negotiation with a close date at the end of the month, but that doesn’t tell you whether the buyer can complete the purchase by then.
- Confirmed budget: Find out whether the buyer has confirmed that funding is available. Interest in your solution doesn’t mean money has been approved, and if the budget is still under discussion, your forecast should show that uncertainty.
- Decision-making authority: Know who can approve the purchase. Your main contact might be excited to move forward without having the authority to make the final call, and knowing who does helps you judge how close the buyer really is to committing.
- Business urgency: Ask what’s pushing the buyer to decide. A clear business need with a reason to act soon is stronger evidence of timing than general interest. If there’s no reason the buyer has to move this quarter, your quarter-end deadline probably won’t change that.
- Required approval steps: Find out what has to happen before the agreement can be signed. Maybe finance needs to approve it, etc. Knowing the remaining steps tells you whether the expected close date is realistic.
- Legal and procurement status: A buyer might be ready to purchase while the agreement is nowhere near ready to sign. Find out whether those reviews have started, what’s still outstanding, and how long the buyer expects them to take, because it can change your forecast a lot.
- Buyer commitments and deadlines: Track the specific actions and deadlines buyers have agreed to. These commitments give you a better indication of whether a deal is progressing toward a decision.
Why Should Sales Forecasting Go Beyond CRM Data?
Your CRM is a good starting point but shouldn’t be your only source. Deal stages, close dates, and forecast categories are useful, but they don’t always tell the whole story. Call recordings show what buyers said about budgets, approvals, timelines, and next steps. Emails keep a record of buyer commitments and agreed dates, and account-team conversations add context about where the risks are.
Why Doesn’t Sales Activity Always Indicate Deal Progress?
A busy pipeline isn’t necessarily a healthy one. You can rack up plenty of meetings, emails, and follow-ups without the buyer getting any closer to deciding, so activity alone makes a poor measure of forecast confidence. What matters is whether the buyer is moving through the purchasing process.
How Do MQLs, SQLs, and Pipeline Affect Sales Forecasting?
MQLs, SQLs, and qualified opportunities all feed into your forecast, but each one tells you something different. MQLs and SQLs help you estimate future pipeline, while qualified opportunities give you a better read on near-term bookings.
The difference comes down to how far each prospect has moved through the buying process and how long it typically takes to turn that interest into revenue. You can use the funnel-based forecasting formula covered earlier to estimate future bookings from lead volume and conversion rates, but you'll also need to account for timing.
How Do MQLs Help Forecast Future Revenue?
Marketing-qualified leads (MQLs) are leads Marketing has flagged as meeting its qualification criteria. They give you an early look at how much pipeline your marketing efforts could produce, but an MQL is still a long way from revenue. To estimate what they’ll contribute, look at how often MQLs become qualified opportunities and how long that usually takes. If your history shows 10% of MQLs eventually turn into opportunities, you can apply that rate to your current MQL volume to estimate the pipeline it might create.
How Do SQLs Help Forecast Future Revenue?
Sales-qualified leads (SQLs) are leads Sales has decided meet its own criteria. They’ve made it further through qualification, so they give you another way to estimate future pipeline. What matters is how often SQLs become real opportunities. SQL volume tells you what’s coming and shouldn’t be counted as revenue already on its way.
How Do Qualified Opportunities Affect Near-Term Sales Forecasts?
Qualified opportunities are the most concrete evidence you have for near-term forecasting, since they’ve moved past lead qualification and into an actual sales process. You can look at each deal’s value, likelihood of closing, expected close date, and what the buyer still has to do. That makes them the right input when you’re forecasting the current month or quarter. Being qualified doesn’t guarantee a deal closes on schedule, though, so you still need to check buyer evidence and timing before it goes into your forecast.
Why Do Consistent MQL and SQL Definitions Matter?
If Marketing and Sales disagree on what makes a lead qualified, your forecasting numbers get shaky fast. Marketing might call a lead qualified based on engagement and fit, while Sales wants more proof of purchase intent before accepting it. Neither definition is automatically wrong, but both teams need to know exactly what each lifecycle stage means. Otherwise you could be applying historical conversion rates built on one definition to leads that are now being qualified under another, which makes your math look precise without making it accurate.
How Do You Avoid Double Counting Leads and Opportunities?
Double counting happens when the same potential revenue shows up in your forecast more than once. When a lead becomes an opportunity, its expected revenue should move over to the opportunity forecast and stop living on as a lead-based projection. You want your lead and pipeline forecasts working as one revenue model, with no stack of overlapping projections for the same deals.
Learn how to connect your leads, pipeline, and revenue data to make better decisions with our Revenue Performance Modeling course 👇
.png?width=1600&height=800&name=RPX%20Cert%20Meta%20Image%20-%20RPM%20(1).png)
What Are the Most Common Sales Forecasting Mistakes?
Even with good techniques and plenty of data, it’s surprisingly easy to get the numbers wrong. Here are seven common mistakes that throw off your numbers and what to do about each one.
1. Confusing Sales Targets With Sales Forecasts
Your target is what you want to hit, and your forecast is what the evidence says you’ll probably hit. They don’t have to match, and plenty of the time they won’t. The mistake comes when you tweak the forecast to look closer to the target instead of admitting the gap.
To avoid it: Build the forecast from history, pipeline data, and buyer evidence, then use any shortfall to figure out what needs to change.
2. Treating Deal Stages and Forecast Confidence as Interchangeable
Reaching the negotiation stage doesn’t guarantee a close. A deal can sit in negotiation while the buyer waits on budget approval. Pipeline stage tells you where the deal sits in your process, while forecast confidence tells you how likely it is to close in a specific period, and the two often disagree.
To avoid it: Judge confidence separately from stage by looking at buyer commitments, outstanding approvals, and realistic timelines.
3. Mistaking Buyer Enthusiasm for Purchase Approval
Everyone loves an excited buyer, but your main contact might be completely sold and still have no authority over the budget or the signature.
To avoid it: Confirm who can approve the purchase and what approvals remain, and check whether the buyer has a realistic path to finishing them inside your forecast period.
4. Relying on Seller-Created Close Dates
Your buyer probably isn’t planning their purchasing process around your quota, so a close date a rep typed in only means something if it matches when the buyer can really decide.
To avoid it: Base close dates on timelines the buyer has confirmed and the steps left before signature.
5. Failing to Update Deal Probabilities and Forecast Categories
A forecast isn’t something you calculate once and leave alone until the quarter ends. Default probabilities tied to pipeline stages are a starting point, but they shouldn’t replace ongoing judgment. Tools like HubSpot help teams stay on top of changing projections, refreshing AI sales projections five times per month (days 1, 7, 14, 21, and 28).
To avoid it: Revisit probabilities and categories whenever new information comes in. A buyer confirming budget might raise your confidence, while a surprise procurement delay might lower your confidence that the deal closes this quarter.
6. Mixing Bookings, Recurring Revenue, and Recognized Revenue
Bookings, recurring revenue, and recognized revenue measure different things, so combining them can make your forecast misleading even when the individual deal details are correct.
To avoid it: Define what you're forecasting before you start, track each metric separately, and make sure everyone knows which number they're looking at.
7. Turning Sales Forecast Reviews Into Status Updates
The review should help you understand what’s likely to happen, what’s putting the forecast at risk, and what the team can do about it. Try asking what the biggest remaining risk is to each deal and what evidence says the buyer can decide within the forecast period. Then ask what one action could reduce that risk this week and who owns it.
To avoid it: Make every review about finding uncertainty and acting on it, so you leave with a clearer forecast and a concrete plan for the biggest risks.
Recap: How Do You Forecast Sales Accurately?
Here's what matters most:
- Historical forecasting: Use past performance to establish a baseline.
- Weighted pipeline forecasting: Multiply deal values by closing probabilities.
- Bottom-up forecasting: Evaluate individual opportunities and buyer commitments.
- Funnel forecasting: Project future bookings using lead volume and conversion rates.
- Revenue metrics: Separate bookings, recurring revenue, and recognized revenue.
- Pipeline health: Monitor deal stages, aging, and close-date changes.
- Buyer evidence: Confirm budgets, decision-makers, approvals, and timelines.
- Lead qualification: Use MQLs and SQLs to estimate future pipeline.
- Forecast categories: Classify opportunities as Commit, Most Likely, or Best Case.
- Scenario planning: Model what happens when major deals close or slip.
- Forecast accuracy: Compare predictions with actual results.
- Ongoing improvement: Update assumptions as new information becomes available.
Frequently Asked Questions About Sales Forecasting
What is sales forecasting?
Sales forecasting is the process of estimating how much revenue a business will generate over a specific period, typically a month or quarter. It uses historical sales performance, current pipeline data, and buyer insights to predict which deals are likely to close and when. Accurate forecasting helps businesses plan budgets, allocate resources, and identify potential revenue shortfalls.
What are the four main sales forecasting methods?
The four main sales forecasting methods are historical forecasting, weighted pipeline forecasting, bottom-up forecasting, and funnel-based forecasting. Historical forecasting uses past results, weighted pipeline forecasting applies closing probabilities to deal values, bottom-up forecasting evaluates individual opportunities, and funnel forecasting projects future bookings using lead volume and conversion rates. Combining methods generally provides a more reliable picture than relying on one alone.
How do you calculate a sales forecast?
The formula depends on the forecasting method. For weighted pipeline forecasting, multiply each opportunity's value by its probability of closing, then add the results. For funnel-based forecasting, multiply lead volume by the conversion-to-opportunity rate, opportunity win rate, and average deal value. Both methods require accurate data and adjustments for when deals are expected to close.
What data do you need for accurate sales forecasting?
Accurate sales forecasting requires three types of data: historical sales performance, current pipeline health, and buyer evidence. Important metrics include win rates, average deal size, sales-cycle length, deal stage aging, and expected close dates. Teams should also verify buyer budgets, decision-making authority, outstanding approvals, and purchasing timelines rather than relying solely on CRM deal stages.
How can you improve sales forecasting accuracy?
Improve forecasting accuracy by combining historical data with deal-level reviews, regularly updating closing probabilities, and validating timelines against buyer commitments. Build multiple forecast scenarios to understand the impact of delayed or lost deals, and distinguish between bookings, recurring revenue, and recognized revenue. Finally, compare forecasts against actual results to identify patterns and refine future predictions.