-2.png)
Why Track Revenue in HubSpot CRM?
HubSpot eliminates conflicting revenue metrics across departments by centralizing everything in one system.
If you fancy yourself a glutton for punishment, try to explain churn to your CFO while staring at one spreadsheet, and then jump into HubSpot to show your sales team another set of numbers.

Spoiler: key metrics like NRR, churn, and expansion MRR won’t match up.
Why?
Because…
Finance lives in QuickBooks or Excel, Sales and RevOps live in HubSpot, and Customer Success is somewhere in the middle trying to figure out if a lost deal in the CRM is actually the same as “churn” in the books.
That’s why companies are moving their retention and revenue reporting directly into HubSpot CRM. By setting up Revenue Snapshots and Rollups, you create a single source of truth for finance, sales, and CS. That way, everyone sees the same numbers, in the same dashboards, updated automatically.
Watch part 1 of our webinar on Why Revenue Reporting in HubSpot CRM Matters.
In this first session, we break down the challenges of fragmented reporting and show how centralizing revenue data in HubSpot creates alignment across Finance, Sales, and CS.👇
Key Takeaways
- HubSpot CRM can track monthly recurring revenue (MRR), churn, expansion, and net revenue retention (NRR) directly.
- It works through Revenue Snapshots and Snapshot Rollups that provide month-over-month reporting.
- Coefficient integration connects HubSpot with accounting tools like QuickBooks or Xero.
- Custom logic in HubSpot captures churn, downgrades, expansions, and new business.
- HubSpot outperforms spreadsheets by automating workflows, ensuring accuracy, and enabling real-time dashboards.
Step 1: What Is a Revenue Snapshot in HubSpot CRM and How Do You Build One?
The first building block of revenue reporting in HubSpot CRM, a core CRM software capability tied to sales automation and inbound marketing reporting, is what we call a Revenue Snapshot.
Think of it like a monthly “photograph” of each customer’s recurring revenue. Instead of trying to piece things together later, you capture a precise record of where that customer stood at the start and end of each month. This is the same discipline HubSpot applies at scale, the company manages over $2.5B in annual recurring revenue (ARR) using these same mechanics.
Each Revenue Snapshot should include four essential pieces of information:
- Company Name or ID – Which customer the snapshot belongs to.
- Revenue Month – The specific month you’re measuring (e.g., “January 2025”).
- Beginning MRR – How much recurring revenue that customer generated at the start of the month.
- Ending MRR – How much recurring revenue they were generating by the end of the month.
This is important because once you capture these two anchor points (Beginning MRR and Ending MRR), you can easily see whether a customer expanded, downgraded, churned, or stayed steady.
For example: If a customer started January at $500 MRR and ended the month at $700 MRR, the snapshot shows a $200 expansion. If they went from $500 to $300, the snapshot records a $200 downgrade. And if they went from $500 to $0, it clearly shows churn.
Without snapshots, you’re stuck pulling this data manually from spreadsheets every month (not fun). With snapshots, it’s automated and always accurate.
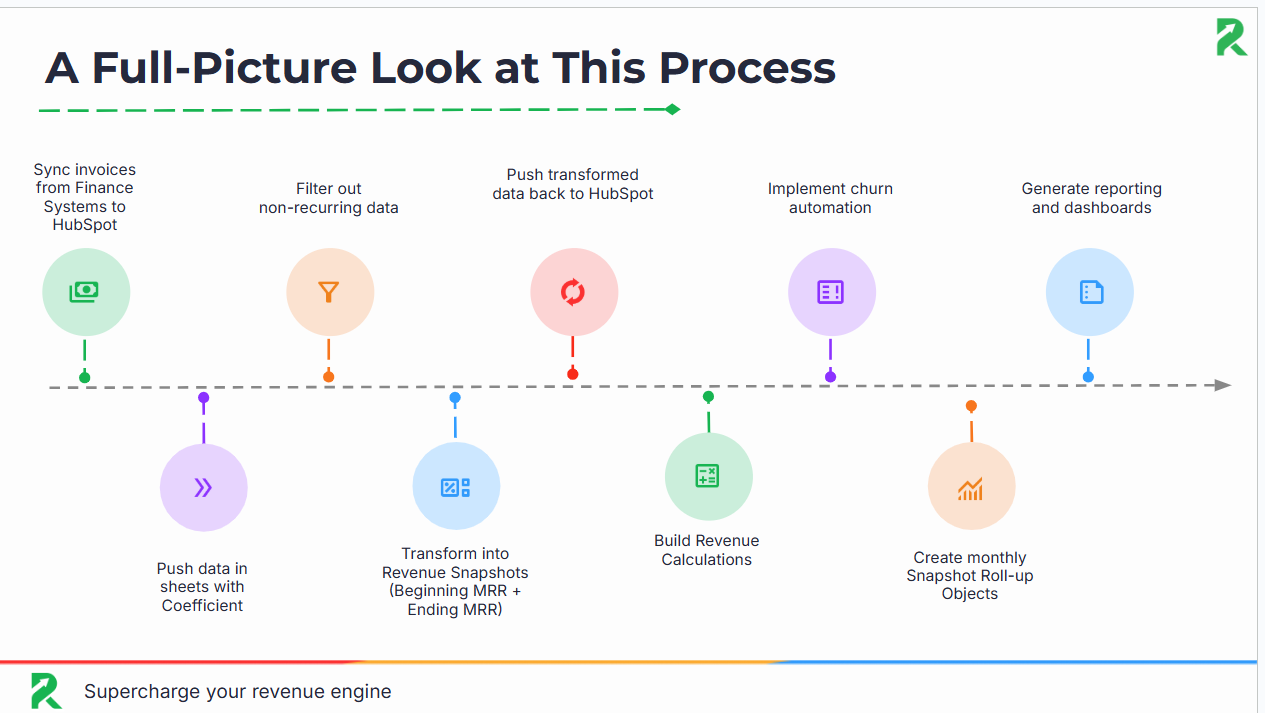
How Do You Capture Revenue Snapshots in HubSpot CRM?
Here’s where tools like Coefficient come in. Coefficient connects HubSpot CRM with your accounting software (such as QuickBooks or Xero). It automatically pulls revenue data into Google Sheets, formats it into Beginning MRR and Ending MRR for each customer, and then syncs that clean dataset back into HubSpot.
That means:
- Finance doesn’t need to export data every month.
- Sales and RevOps can trust the numbers in HubSpot.
- You always have a single source of truth for revenue metrics.
Step 2: How Do You Create a Custom Object in HubSpot CRM for Revenue Snapshots?
Once you’ve defined what a Revenue Snapshot looks like, the next step is to house that data properly inside HubSpot CRM. To do this, you’ll create a custom object called Revenue Snapshot.
This object acts as the dedicated container for every snapshot you pull in, ensuring you’re not just dumping data into random fields but instead building a structured and repeatable revenue dataset.
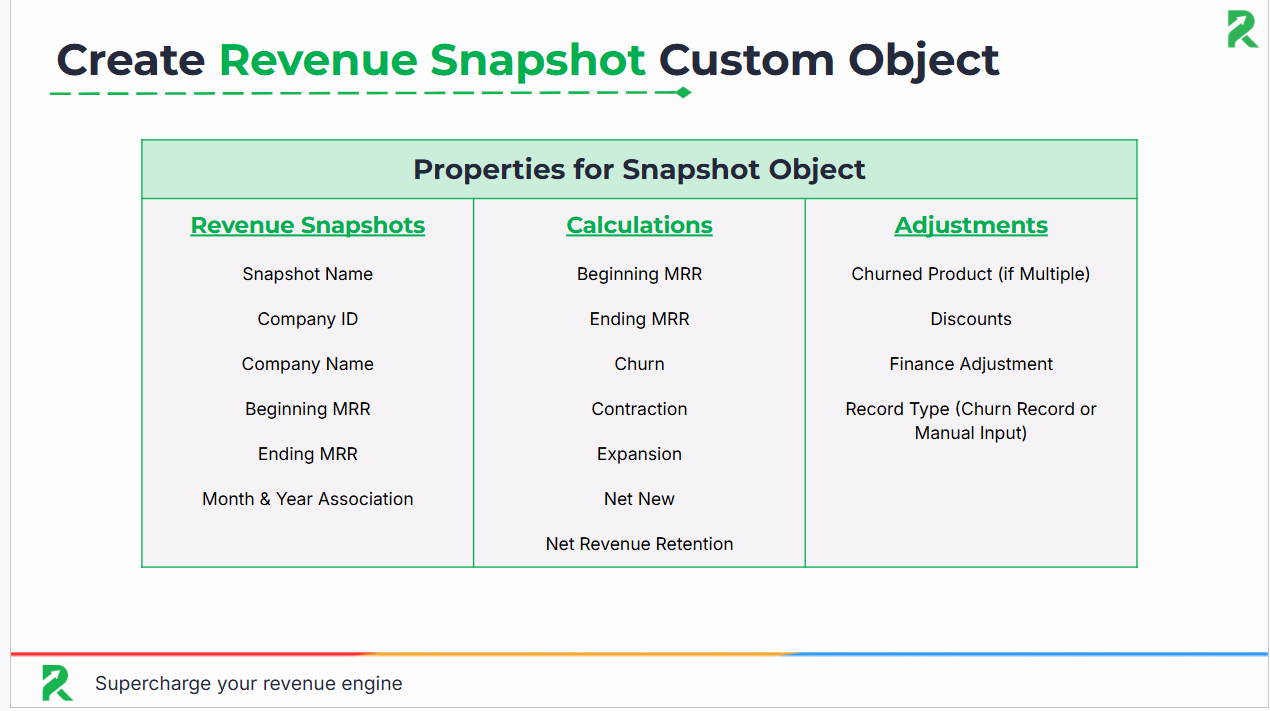
What Properties Should You Include in a Revenue Snapshot Custom Object?
When you build the custom object, you’ll want to define key properties that capture all the levers of recurring revenue growth. At minimum, add:
- Beginning MRR – what the customer was paying at the start of the month
- Ending MRR – what the customer was paying at the end of the month
- Net New – how much new MRR was added during the month
- Churn – how much MRR was lost due to cancellations
- Contraction – how much MRR was reduced (e.g., downgrades)
- Expansion – how much MRR grew (e.g., upgrades or add-ons)
Why Does a Revenue Snapshot Custom Object Matter for Reporting?
This custom object becomes the foundation of your reporting. It’s what lets you analyze revenue at the account level, track movement over time, and ultimately answer questions like: Where are we actually growing? Where are we leaking revenue?
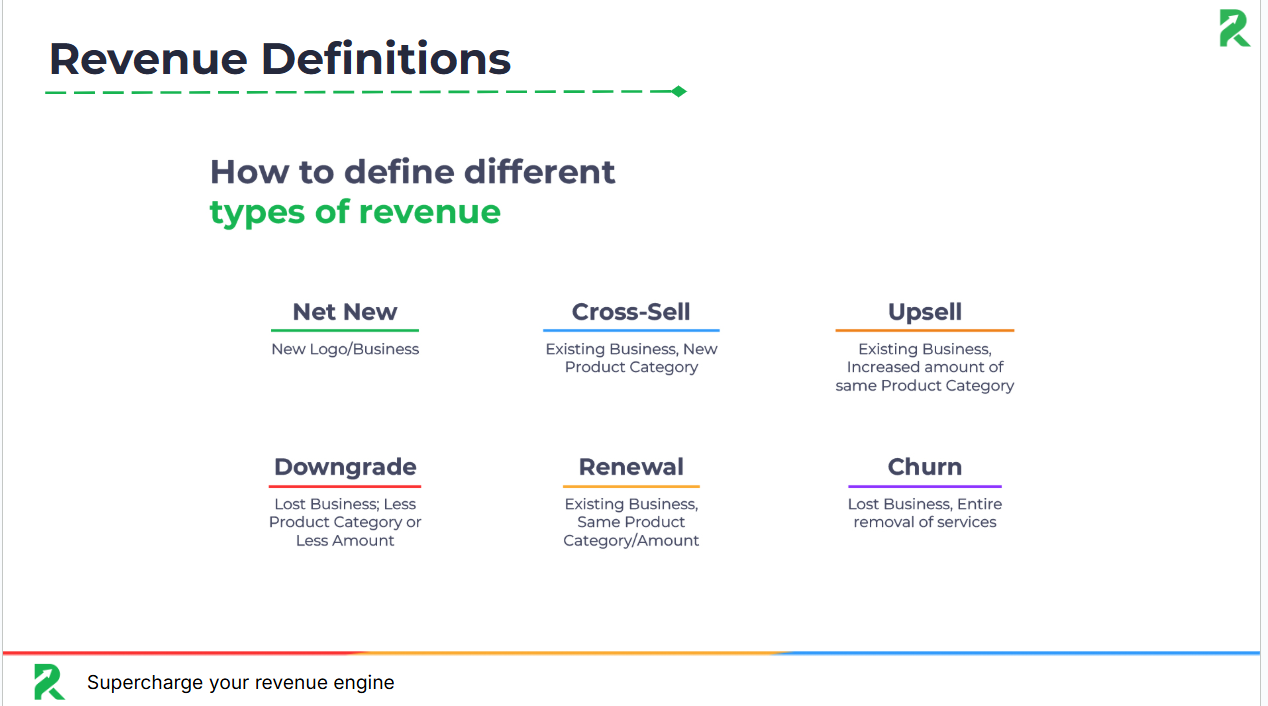
Step 3: How Do You Define Revenue Metrics in Plain Language Inside HubSpot CRM?
With your Revenue Snapshot object set up, it’s time to teach HubSpot how to recognize the key revenue movements. Think of this step as basically telling HubSpot what the rules are.
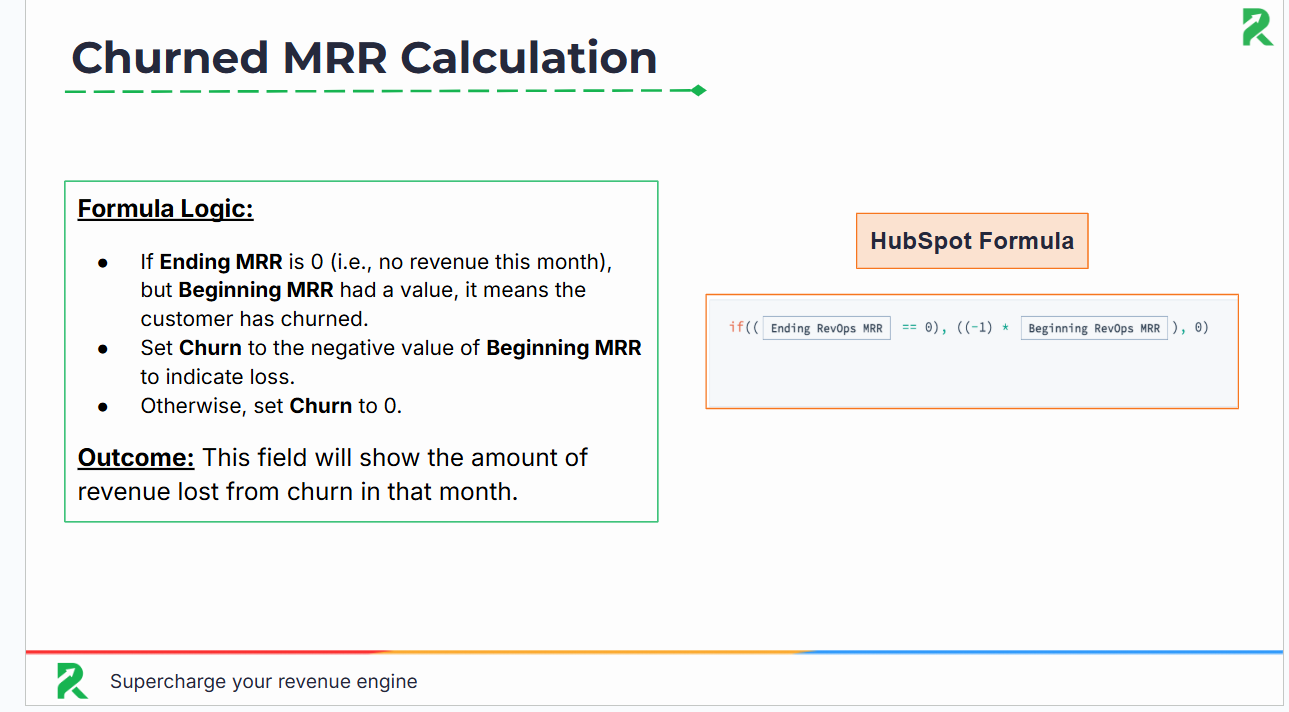
What Is Churn MRR and How Do You Calculate It in HubSpot?
When a customer had revenue last month but drops to zero this month.
Example: Beginning MRR = $200, Ending MRR = $0 → Churn = $200
What Is Contraction MRR and How Do You Track It?
When a customer stays but spends less.
Example: Beginning MRR = $500, Ending MRR = $300 → Contraction = $200
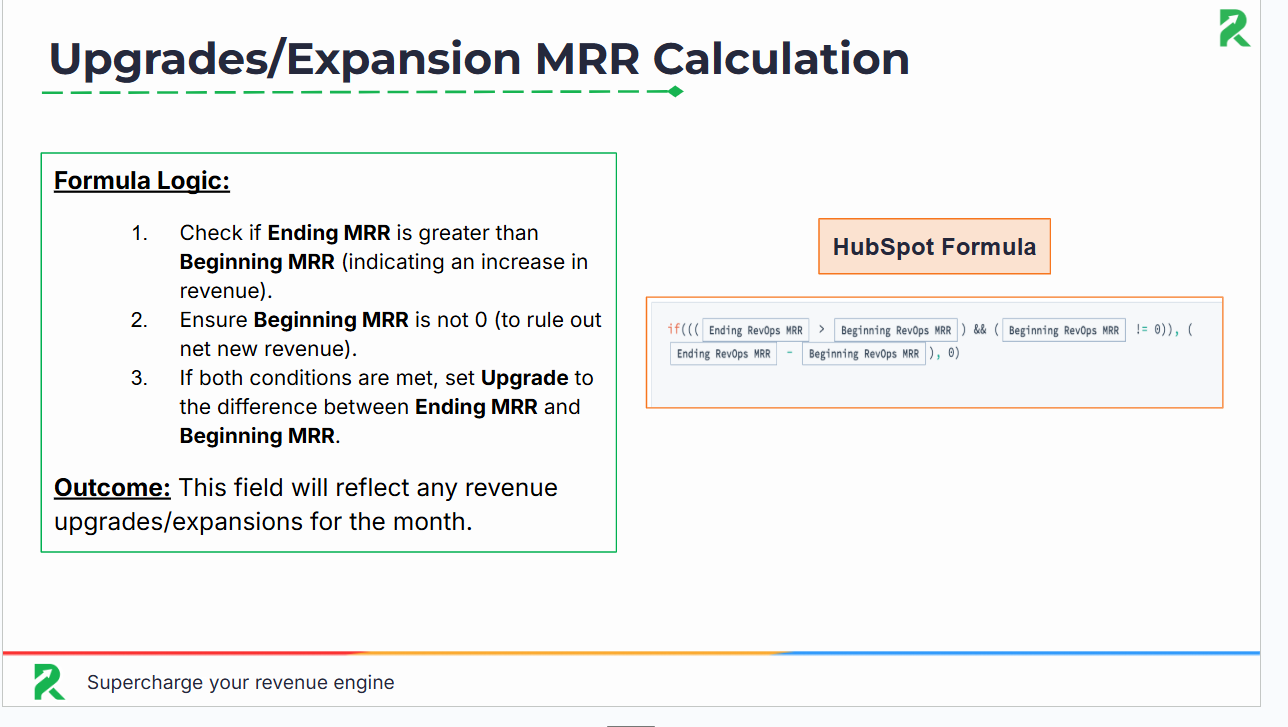
What Is Expansion MRR and How Does HubSpot Capture It?
When a customer increases spending.
Example: Beginning MRR = $700, Ending MRR = $900 → Expansion = $200
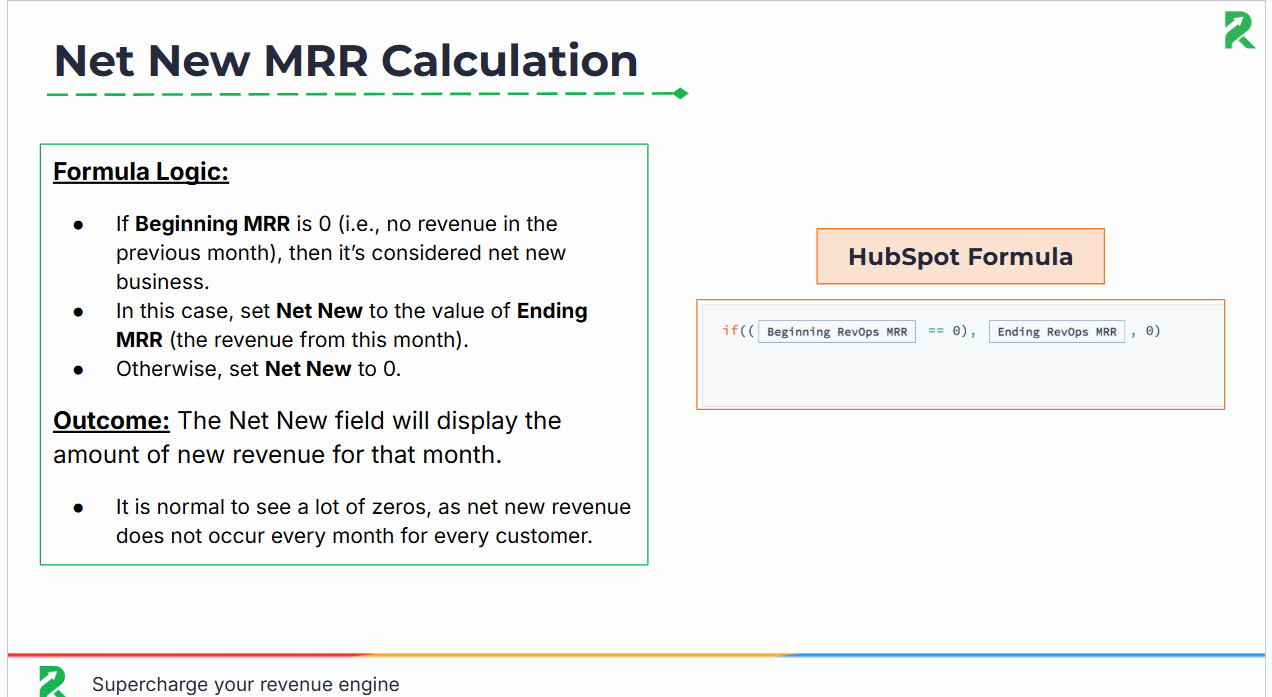
What Is Net New MRR and When Does It Apply?
When a brand-new customer starts paying.
Example: Beginning MRR = $0, Ending MRR = $400 → Net New = $400
These rules can be built as calculated properties in HubSpot, so the math runs automatically in the background with no manual updates required.
Step 4: How Do You Roll Up Revenue Data in HubSpot CRM?
Snapshots give you company-level revenue data…but not necessarily the big picture.
That’s where the Snapshot Rollup object comes in. It;s kind of like a monthly scoreboard.
What Is a Snapshot Rollup in HubSpot CRM?
- Each Rollup represents a single month.
- It links to all the company Snapshots from that month.
- It stores the aggregated values you care about:
- Beginning MRR (sum of all companies’ MRR at start of month)
- Ending MRR (sum of all companies at end of month)
- Net New, Expansion, Contraction, Churn
- Adjustments (discounts, credits, etc.)
- Beginning MRR (sum of all companies’ MRR at start of month)
Why Does a Rollup Matter for Revenue Reporting?
- Instead of just staring at individual accounts, you now see the macro revenue trendline.
- This bridges the gap between account-level retention (Snapshots) and portfolio-level reporting.
How Do You Build a Rollup in HubSpot CRM?
- Create a custom object for Rollups with properties for each metric.
- Set up workflows to populate those properties automatically by summing values from Snapshots.
- Use reports/dashboards to chart Rollups month-over-month.
Step 5: How Do You Associate Snapshots with Rollups in HubSpot CRM?
With Snapshots (company-level) and Rollups (portfolio-level) in place, the last step is connecting the dots so your data actually tells a month-over-month story.
How Do You Automatically Associate Snapshots with Rollups?
Set up a HubSpot workflow that automatically associates every Snapshot with its Rollup for the same month.
Example: all February Snapshots get linked to the February Rollup record. This ensures data stays consistent without manual effort.
How Do You Backfill Rollups for Historical Data?
If you’re reconstructing history, create Rollup records for past months (e.g., Jan–Dec 2024) and then link each company’s old Snapshots to those Rollups. That way you preserve a full year-over-year picture.
What Is the End Result of Associating Snapshots with Rollups?
With Snapshots linked to Rollups, you’ll have a structured month-over-month record of revenue retention. This makes it easy to measure trends, run cohort analysis, and spot where expansion, contraction, or churn are happening.
Why Does Associating Snapshots with Rollups Matter for Revenue Retention?
By associating Snapshots with Rollups, you turn static monthly reports into a time series of revenue retention. This lets you:
- Compare company vs. portfolio retention side-by-side.
- Spot anomalies (e.g., one company tanks retention while the rest hold steady).
- Build trust in your model as stakeholders can actually follow the data month to month without exporting spreadsheets.
Step 6: How Do You Validate Accuracy in HubSpot Revenue Reporting?
Before you start trusting retention numbers, you need to confirm that what HubSpot is showing matches reality. This step prevents bad assumptions down the road.
What Core Revenue Reports Should You Run in HubSpot?
- Beginning MRR (what you started with)
- Ending MRR (what you finished with)
- Expansion (upsells, cross-sells)
- Contraction (downgrades)
- Churn (lost customers)
- Net New (brand new customer revenue)
How Do You Cross-Check HubSpot Data with Finance Systems?
- Pull the same numbers from your accounting tool (QuickBooks, NetSuite, Xero, etc.).
- Compare the totals with your HubSpot reports.
How Do You Resolve Mismatches Between HubSpot and Finance?
- If HubSpot says churn was $30k and finance says $28k, figure it out..
- Common culprits: missing renewal dates, deals not properly closed out, timing differences in when revenue is recognized.
When Should You Lock the Process Before Scaling?
- Once HubSpot and Finance tie out, you’ve got a system you can trust.
- From there, you can build automated reports, share dashboards, and make decisions without second-guessing.
Step 7: How Do You Build Insightful Dashboards in HubSpot CRM?
Now that you’ve defined and validated all the MRR components, it’s time to bring them together in dashboards.
Your dashboards should include:
- Starting MRR vs. Ending MRR – a clear view of overall movement.
- Breakouts of new business, expansions, contractions, and churn – not as definitions again, but as trend lines.
- Month-over-month comparisons – so you can spot shifts quickly.
The point is to visualize what’s driving performance. Dashboards make it obvious if churn is creeping up, if expansions are covering downgrades, or if growth is truly sustainable.
When you do this right, NRR becomes part of the daily rhythm for sales, CS, and leadership, something the whole company can track, not just finance.
Step 8: How Do You Calculate Net Revenue Retention in HubSpot CRM?
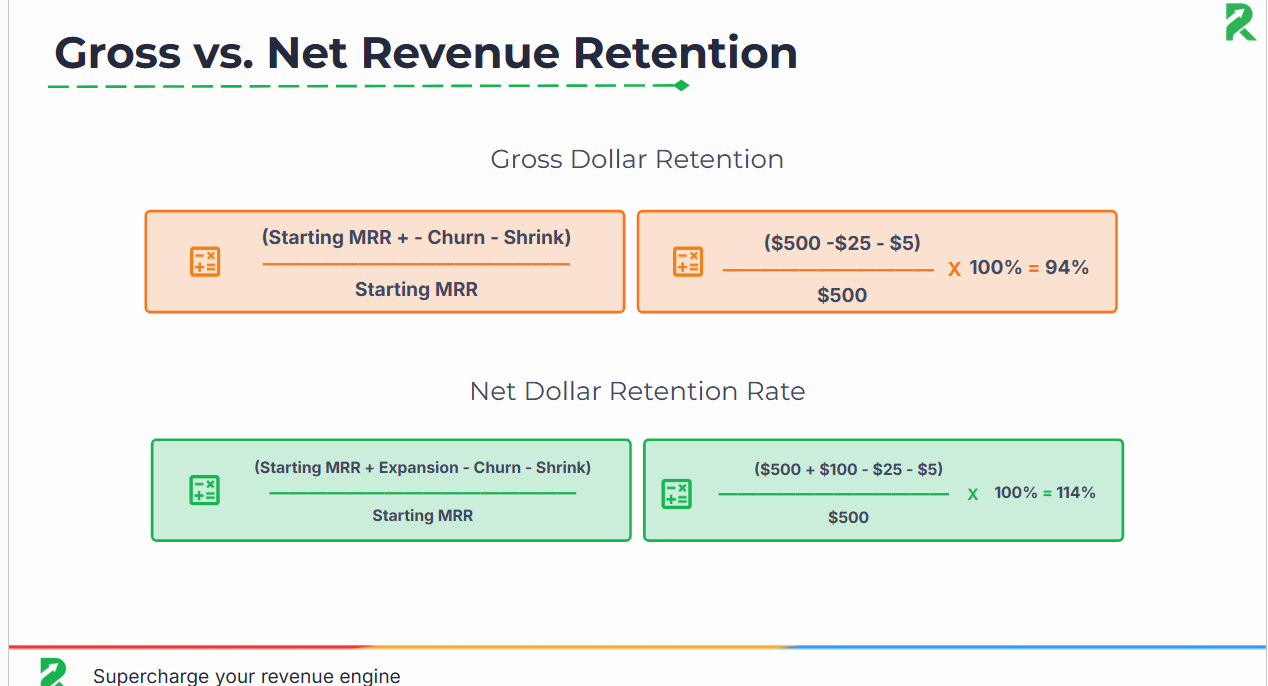
Net Revenue Retention is the ultimate measure of whether your existing customers are fueling growth. It shows how much recurring revenue you keep (and expand) after factoring in upgrades, downgrades, and churn, without counting any brand-new customers.
What Is the Formula for Calculating NRR?
NRR = (Beginning MRR + Expansion – Contraction – Churn) ÷ Beginning MRR
Example:
- Beginning MRR = $100,000
- Expansion = $20,000
- Contraction = $10,000
- Churn = $5,000
NRR = (100,000 + 20,000 – 10,000 – 5,000) ÷ 100,000
NRR = 105,000 ÷ 100,000
NRR = 1.05 → 105%
How Should You Use NRR for Benchmarking, Tracking, and Reporting?
- Benchmarking: Anything above 100% means you’re growing revenue from your base without landing new customers. Best-in-class SaaS companies often target 120%+ NRR. HubSpot itself has reached 115% NRR at its peak and reported 102% in Q1 2025, a reminder that consistent, above-100% retention is both realistic and sustainable when tracked correctly.
- Trend Tracking: Run NRR monthly, then roll it up quarterly and annually. Look for consistency as big swings often signal data accuracy issues or structural problems in pricing, retention, or upsell strategy.
- Segmentation: Break NRR down by customer cohort (SMB vs. Enterprise, product line, region). This shows where expansion and churn dynamics differ and where to double down.
- Board/Investor Reporting: NRR is often the first metric VCs and growth equity funds ask for because it encapsulates retention, upsell, and account health in one number.
Step 9: How Does HubSpot CRM Adapt Revenue Reporting for Different Business Models?
Not every company measures revenue the same way. Here’s how to think about Net Revenue Retention depending on your business model:
SaaS businesses:
Expansions and downgrades are the key drivers. Think seat licenses, feature upgrades, or customers dropping down to a smaller plan.
Services businesses:
Renewals and retainer size matter most. Churn happens when a client ends a contract, and contraction happens when they reduce scope or hours.
Hybrid models:
You’ll need to track both. Many hybrids also have usage-based revenue layered in. For example, Zoom charging per participant or HubSpot charging per marketing contact.
The good news is that HubSpot CRM is flexible enough to model each scenario, as long as you define your revenue categories clearly and capture the data consistently. And it's not just theory either as 97.8% of HubSpot’s own revenue comes from subscriptions, proving the platform was built to handle recurring models at scale.
How Might This Look in Different Industries?
For healthcare organizations, HubSpot CRM can track recurring patient subscription revenue. In real estate, you can adapt Snapshots to measure property management retainers. Even nonprofits can use it to report on recurring donor contributions. The flexibility of HubSpot CRM means it adapts to industry-specific revenue models without extra tools.
Step 10: Why Does HubSpot CRM Outperform Excel for Revenue Reporting?
A lot of companies start with spreadsheets. Here’s how Excel/Sheets stack up against HubSpot CRM (especially when paired with Coefficient):
|
Feature |
HubSpot CRM (w/ Coefficient) |
Excel/Sheets |
|
Data Accuracy |
Automated, synced from finance |
Manual, error-prone |
|
Scalability |
Handles thousands of records |
Breaks at scale |
|
Automation |
Workflows + auto-calculations |
None |
|
Reporting |
Live dashboards in HubSpot |
Static |
|
Team access |
Shared across Finance + Sales |
Limited sharing |
Bottom line: HubSpot CRM gives you accuracy, automation, and scale that spreadsheets can’t touch.
Ready to see how it all comes together? In Part 2 of our webinar, we walk through setting up Revenue Snapshots, Rollups, and dashboards inside HubSpot CRM, plus advanced tips for recurring revenue reporting. 👇
Recap: How to Track Revenue in HubSpot CRM
To build reliable revenue reporting in HubSpot, organizations should focus on:
- Capture monthly Revenue Snapshots: Record Beginning MRR, Ending MRR, and customer-level revenue changes each month to create an accurate historical record.
- Build structured revenue data models: Use custom objects, calculated properties, and finance integrations to standardize how recurring revenue metrics are stored and measured.
- Automate revenue calculations: Configure HubSpot workflows to calculate Net New MRR, Expansion MRR, Contraction MRR, Churn MRR, and other recurring revenue metrics without manual spreadsheets.
- Create monthly Snapshot Rollups: Aggregate customer-level revenue changes into portfolio-level reporting that supports executive dashboards, forecasting, and board reporting.
- Validate CRM data against finance systems: Regularly reconcile HubSpot with accounting platforms like QuickBooks, Xero, or NetSuite to ensure reporting accuracy and stakeholder confidence.
- Measure long-term revenue performance: Build dashboards that track MRR trends, NRR, churn, expansion, cohort performance, and recurring revenue growth to guide strategic decisions.
FAQs on HubSpot CRM Revenue Reporting
Why use HubSpot instead of Excel?
HubSpot automates churn/expansion tracking, keeps data accurate, and creates dashboards accessible to sales, finance, and CS.
Can I do this without HubSpot Enterprise?
Yes. While some features are Enterprise-only, HubSpot software still allows Pro users to integrate Coefficient and automate much of the setup.
How often should I refresh revenue Snapshots?
Monthly is standard. Some fast-scaling teams update weekly.
How does HubSpot compare to Salesforce for revenue tracking?
HubSpot is easier to configure without developers, while Salesforce often requires admins or consultants.
The Revenue Performance Model
Do you want to track the entire revenue journey in your CRM so you can see what's broken, why it happened, and where to fix it?
Download the Revenue Performance Model HERE
.png?width=2986&height=2233&name=RPM%20PDF%20Preview%20(2).png)
-1.png)
-1.png)
-1.png)