
Every company today claims to be “doing RevOps.” Some build structure, some improvise, but very few can prove whether their RevOps is actually moving the revenue needle. That’s where understanding your journey to maturity comes in. And it’s also where the Revenue Performance Model (RPM) connects the dots. The Maturity Model shows you the stages; the RPM shows you the math, metrics, and levers that make progress measurable.
But how do you know you’re progressing, and not just adding tools or running in circles? The RevOps Maturity Model explains the levels, but pairing it with RPM lets you test your assumptions against hard numbers: volume metrics, conversion rates, and revenue retention formulas.
To help, we’ve built the 5-Level RevOps Maturity Model, a roadmap to assess where your company stands today and where you need to go. Each level defines the systems, KPIs, and playbooks required to graduate. But now we also layer in the Revenue Performance Model to make those levels operational: tying your maturity score directly to measurable revenue outcomes.

TL;DR: 5-Level RevOps Maturity Model (Powered by RPM)
- Level 1: Organize and integrate your data, connect core tools, adopt your CRM, and get teams using RevOps playbooks. In RPM terms: establish Volume Metrics (sessions, leads, deals) and lock in shared definitions.
- Level 2: Measure primary KPIs, check core data model effectiveness, monitor playbook adoption, and track progress to targets. In RPM: layer in Conversion Metrics (CR0–CR4) to see what’s working and what isn’t.
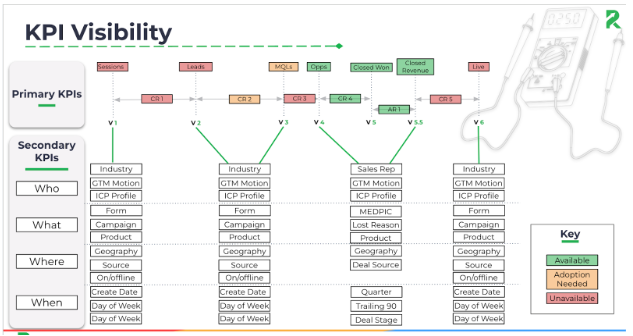
- Level 3: Review KPIs regularly, track supporting metrics, fix revenue leaks, and train teams to improve performance. In RPM: add secondary KPI partitions (who/what/where/when) to diagnose revenue leakage.
- Level 4: Break KPIs into who, what, where, when; add secondary metrics for deeper insights; improve forecasting accuracy. In RPM: connect those insights into forecasting models for both funnel and flywheel.
- Level 5: Achieve full revenue visibility with real-time tracking, proactive leak detection, proven playbooks, and predictive analytics. In RPM: track Net Revenue Retention across recurring, non-recurring, and usage-based revenue to forecast true growth.
How Does it Work? (Maturity + RPM Together)
Linear Progression with Measurable Revenue
The Maturity Model emphasizes moving sequentially through each level, but in practice, many companies think they’re ready to advance before they’ve proven it. That’s where the Revenue Performance Model (RPM) keeps you honest. At each stage, RPM metrics (Volume, Conversion, Retention) show whether you’ve actually achieved the foundation required. It’s not just “we think adoption is happening,” it’s “CRM data shows CR1 is improving by 12%”, evidence you’re ready to move forward.
What are the requirements for each RevOps maturity level?
Each level still has a beginning and end state, but RPM makes those requirements measurable. For example:
• Level 1 → Level 2: Before you can move up, V1–V6 metrics (sessions through closed won) must be cleanly defined in your CRM and consistently tracked.
• Level 2 → Level 3: You don’t advance unless you’re reliably calculating CR0–CR4 conversion rates and using them in reviews.
• Level 4 → Level 5: Graduation requires NRR formulas to be set up and operational in your dashboards.
By making the end states tied to actual data integrity and availability, the Maturity Model becomes less about opinion and more about proof.
How does RPM help diagnose and solve RevOps pain points?
The model has always encouraged solving current challenges before leveling up. But RPM gives you a sharper tool: secondary KPI partitions. Instead of saying “our conversion rate dropped,” RPM forces the follow-up: “by rep, by product, by territory, where exactly did the leak happen?” This means pain points are diagnosed and assigned to owners. That’s the difference between guessing and fixing.

What defines Level 1 of the RevOps Maturity Model?
Purpose
Level 1 is all about the foundation. You can’t analyze or optimize what you can’t see. Here, companies integrate critical data sources, align leadership, and adopt structured processes in a single CRM. In RPM terms, this is where you define the Volume Metrics (V1–V6): sessions, leads, MQLs, SQLs, opportunities, and closed won. Without those cleanly captured and consistently defined, the rest of the maturity journey is built on sand.
Key Components
Data Integration
Everything starts here. Establish connectors between HubSpot and your critical systems — marketing automation, enablement, CS — but don’t stop at syncing. In RPM, you must ensure these integrations feed the core volume metrics (V1–V6).
• V1 Sessions (analytics)
• V2 Leads (contacts)
• V3 MQLs
• V4 SQLs
• V5 Opportunities (deals)
• V6 Closed Won (deals)
Mapping fields and setting data quality rules ensures these counts are reliable.
Bowtie Data Model vs. RPM Data Model
Traditionally, Level 1 stops at the Bowtie Model. RPM goes further by aligning directly to CRM objects and assigning each object a place in the math.
• Contacts/Companies → V2–V4
• Deals → V5–V6
• Revenue Data → V7–V13 (later levels)
Instead of just visualizing relationships, RPM creates a diagnostic structure that shows how breakdowns in one object (e.g., weak SQL quality) cascade into missed revenue.

RevOps Playbooks with RPM Metrics
Playbooks are where process meets numbers. Instead of generic “lead management,” tie each playbook step to its RPM metric:
• Lead management → impacts CR0 and CR1
• Opportunity management → impacts CR3 and CR4
• Onboarding → sets the stage for V7–V13 in the flywheel
This makes playbooks measurable, not theoretical.
CRM Adoption
CRM adoption isn’t just about “using the tool.” It’s about making sure everyone enters data consistently, so RPM metrics can be trusted. Training should cover not only how to log activities but also why definitions matter (e.g., what exactly qualifies as a SQL). Without that alignment, your CR2 conversion rate will be meaningless.Endstate
• HubSpot CRM integrated with core third-party applications• Volume metrics V1–V6 defined, tracked, and trusted
• Revenue mapping aligned not only to Bowtie but to RPM’s cross-object model
• Foundational RevOps playbooks tied to RPM conversion metrics
• Teams adopting and executing RevOps processes within the CRM of record — and leadership using those metrics to validate readiness for Level 2

What defines Level 2 of the RevOps Maturity Model?
Purpose
Level 2 moves from building the foundation to measuring whether it’s working. The goal is to answer: Is our core data model effective? Are playbooks being adopted? Are we on track for revenue targets? In RPM terms, this means your primary KPIs are the funnel’s Volume Metrics (V1–V6) and Conversion Metrics (CR0–CR4). Instead of just “tracking performance,” you now have math-based proof of how sessions become leads, leads become SQLs, and SQLs become revenue.
Key Components
Establishing Primary KPIs
The most critical Level 2 task is defining and agreeing on RPM’s Volume & Conversion metrics:
• V1 Sessions → V2 Leads → CR0
• V2 Leads → V3 MQLs → CR1
• V3 MQLs → V4 SQLs → CR2
• V4 SQLs → V5 Opportunities → CR3
• V5 Opportunities → V6 Closed Won → CR4
These become your “truth set.” Set targets for each, benchmark against history, and use CRM automation to monitor real-time movement. CAC and LTV still matter, but RPM ensures those top-level metrics are supported by the funnel math.
Evaluating Core Data Model Effectiveness
Instead of asking “does our data model work,” RPM forces the question: “can we calculate CR0–CR4 accurately and consistently?” If you can’t, the model is broken.
• Audit each volume metric source (analytics, contacts, deals).
• Run data quality checks...can leadership pull CR2 (MQL → SQL) without exporting to Excel?
• Gather user feedback on whether definitions are clear. If Marketing says 300 leads but Sales sees 200 SQLs, RPM exposes that misalignment immediately.
Assessing RevOps Playbook Adoption
Playbook adoption can’t just be measured by usage rates. RPM allows you to tie adoption to conversion improvements. Example: If your Opportunity Playbook is in use, does CR3 (SQL → Opportunity) improve?
Adoption barriers should be measured not only through surveys but also through stalled metrics. If CR1 is stagnant, your Lead → MQL playbook may not be used or isn’t working.
Analyzing Revenue Target Attainment
Revenue forecasting is no longer a black box. RPM enables revenue plans to be validated by the funnel math:
• Start with V1–V6 actuals.
• Use CR0–CR4 averages to project pipeline.
• Layer in historical deal size to estimate revenue.
Root cause analysis becomes faster: if revenue misses are due to CR2 collapsing, you know the problem is qualification. If V1 sessions are stable but CR0 drops, it’s top-of-funnel quality. RPM translates revenue targets into operational levers.
Endstate
Volume metrics V1–V6 cleanly defined and tracked
• Conversion rates CR0–CR4 accurately calculated and trusted
• Core data model validated by its ability to support these metrics
• Playbook adoption tied to measurable improvements in conversion rates
• Revenue targets supported by RPM projections, not just “gut feel”
• Clear root-cause diagnostics available when performance slips
What defines Level 3 of the RevOps Maturity Model?
Purpose
Level 3 is where RevOps starts to move beyond tracking into improving performance. The goal is to review your primary KPIs, prioritize secondary KPIs, and tackle revenue leakage head-on. In RPM, this means going one layer deeper. You are no longer just looking at V1–V6 and CR0–CR4. You are partitioning those metrics into the "who, what, where, and when" categories to diagnose problems. The payoff is that leakage is not just identified, it is quantified and assigned.
Key Components
Reviewing Primary KPIs
Regular reviews should now be tied directly to RPM metrics. Look at V1–V6 and CR0–CR4 side by side. Are sessions growing while CR0 drops? Is CR2 falling in certain quarters? These trends should be flagged automatically. Collaboration is no longer a generic meeting; it is a KPI review that uses one shared math model. Continuous optimization happens when the team can see cause-and-effect clearly in the funnel.Prioritizing Secondary KPIs
Secondary KPIs are the partitions that make RPM powerful. Break down CR2 by rep, CR3 by territory, or V5 by product line. This allows you to see exactly where the blockage or lift is happening. Instead of setting vague targets like "improve conversion," you can set precise goals such as "raise CR1 for inbound webinar leads by 10 percent." Monitoring happens at the level of these partitions, which reveals what is actually driving primary KPI movement.Identifying Revenue Leakage
Leakage should no longer be a guess. Use RPM to track where dollars are slipping through the cracks. If CR3 is strong but revenue still misses, check if V7 (starting revenue) to V13 (ending revenue) is being eroded by churn. If SQLs are steady but opportunities are falling off, partition CR2 by source to see which channels are failing. Opportunity mapping becomes targeted: fix the specific broken stage rather than throwing resources at the whole funnel.Training Revenue Teams on Addressing Revenue Leakage
Training at Level 3 should be tied to the actual leakage identified by RPM. If the data shows reps on the West Coast underperforming CR2, training is targeted to qualification. If churn is causing V13 to shrink, CS teams get trained on renewal and expansion playbooks. Best practices are no longer theoretical; they are prescriptions tied to metrics. Progress is monitored by watching whether the targeted KPI improves.Endstate
• Regular reviews of V1–V6 and CR0–CR4 with clear insights pulled from partitions• Secondary KPIs mapped by who, what, where, when to provide context behind performance changes
• Revenue leakage tracked, quantified, and assigned to specific teams
• Training directly tied to RPM findings with measurable before-and-after results
• Business performance improved not by opinion but by addressing metrics that prove impact
What defines Level 4 of the RevOps Maturity Model?
Purpose
Level 4 is where RevOps maturity turns into a microscope. You are no longer satisfied with just tracking conversion rates. You want to know why they move. In RPM, this is where you take V1–V6 and CR0–CR4 and split them into four diagnostic lenses: who, what, where, and when. This creates the context that turns raw numbers into actionable insight and makes forecasting sharper.
Key Components
Partitioning Primary KPIs
Partitioning is built into RPM. Each volume and conversion metric can be sliced across four dimensions:
• Who: Which personas, ICPs, or customer stages are converting?
• What: Which product categories, SKUs, or services are driving the most opportunities?
• Where: Which regions or territories are consistently beating or missing CR targets?
• When: Which months or quarters show anomalies in conversion rates?
This makes it clear whether a dip in CR2 is a broad problem or isolated to one rep, one market, or one product.
Developing Secondary KPIs
RPM is designed for this. Secondary KPIs are not extra noise; they are the filters you run your primary metrics through to find the root cause. For example:• CR1 drops overall → partition by lead source → inbound webinar leads down 20%
• V5 opportunities stagnant → partition by rep → two territories lagging behind
Targets are set not just broadly but per partition. Monitoring means watching how each partition contributes to or drags down the total.
Enhancing Forecasting Capabilities
Forecasting at Level 4 is where RPM shines. By integrating partitions, forecasts stop being a single line and start reflecting reality.
• Use who/what/where/when splits to weight forecasts by the factors that historically influence performance.
• Refine quarterly based on how partitions performed in the past.
• Collaboration becomes sharper: sales, marketing, and CS no longer argue over anecdotal stories; they review the same partitions to agree on what will move the number.
Endstate
• Primary KPIs (V1–V6, CR0–CR4) are partitioned consistently by who, what, where, and when
• Teams can explain exactly why a KPI moved up or down
• Forecasts are built on partitions, not just historical totals
• Leaders can run scenarios: “What happens if West Coast CR3 lags again?” and see the impact instantly
• Forecasting becomes trusted because it is rooted in partitions that align across GTM teams
What defines Level 5 of the RevOps Maturity Model?
Purpose
Level 5 is where you stop guessing and see the full revenue engine, end-to-end. It is not just about visibility into funnel metrics but about proving retention and expansion with data. In RPM, this stage means tracking the full flywheel: starting revenue (V7), net new recurring revenue, cross-sell, upgrades, downgrades, churn, and ending revenue (V13). Together these roll up into Net Revenue Retention, the ultimate health metric.
Key Components
Executing Revenue Plans
At Level 5, teams are not just aligned on a “plan” but on RPM data. Sales, marketing, CS, and finance all work off the same V1–V13 and CR0–CR4 dashboards. Monitoring is tied to whether NRR is above or below 100 percent. Decisions are made by checking whether expansion revenue offsets churn or whether CR3 is slipping in one territory. The revenue plan becomes operational math rather than a slide deck.Proactive Revenue Leakage Mitigation
RPM makes leakage visible before it becomes fatal. Real-time alerts can be tied to NRR components. If downgrades spike or churn jumps, RPM shows it instantly in V11 and V12. Root cause analysis happens at the partition level (by product, by rep, by region) so fixes can be specific. Processes are optimized continuously by tracking whether those partitions improve over time.Growth Playbooks Aligned to RPM
Playbooks at Level 5 are tested against revenue metrics, not just adoption. For example:
• An expansion playbook is judged on whether upgrades (V10) and cross-sells (V9) increase.
• A renewal playbook is measured by whether churn (V12) decreases.
Performance monitoring is RPM-driven. If the numbers move in the right direction, the playbook is validated. If not, it is adjusted.
Predictive Analytics
Forecasting moves beyond pipeline projections. With RPM, predictive models use both funnel metrics (V1–V6, CR0–CR4) and flywheel metrics (V7–V13). Scenario planning becomes concrete: “What if churn rises by 2 percent?” or “What if upgrades double?” Continuous improvement means refining forecasts as partitions shift. The result is a model that shows exactly where to focus to keep NRR above 100 percent.
EndState
- Revenue plans executed with shared RPM dashboards
- Net Revenue Retention tracked and targeted as the ultimate health metric
- Revenue leakage identified instantly in V11 and V12 and addressed with specific actions
- Playbooks validated by RPM numbers, not just usage
- Predictive analytics built on both funnel and flywheel metrics for accurate scenario planning
Frequently Asked Questions About the RevOps Maturity Model
What is the RevOps Maturity Model?
The RevOps Maturity Model is a framework that helps businesses evaluate how effectively their revenue operations support sustainable growth. It measures maturity across areas like CRM adoption, data quality, reporting, forecasting, automation, and cross-functional alignment, providing a roadmap for continuous improvement.
What are the five levels of RevOps maturity?
The five levels of RevOps maturity typically progress from building a strong operational foundation to achieving predictive, data-driven revenue optimization. As organizations mature, they move from organizing systems and tracking core metrics to improving forecasting, identifying revenue leaks, and optimizing Net Revenue Retention (NRR) using real-time data.
How does the Revenue Performance Model (RPM) support the RevOps Maturity Model?
The Revenue Performance Model (RPM) makes the RevOps Maturity Model measurable by connecting every maturity level to specific revenue metrics. It tracks volume metrics, conversion rates, revenue retention, and forecasting so businesses can validate progress with data instead of assumptions.
How do you assess your RevOps maturity?
A RevOps maturity assessment evaluates the health of your CRM, data model, reporting, automation, sales and marketing alignment, customer success processes, and revenue metrics. The goal is to identify operational gaps, prioritize improvements, and create a roadmap for moving to the next level of maturity.
Why is RevOps maturity important?
Higher RevOps maturity helps businesses improve forecasting accuracy, increase operational efficiency, strengthen team alignment, reduce revenue leakage, and make better decisions using trusted data. Rather than adding more tools, mature RevOps organizations build systems that consistently drive predictable, scalable revenue growth.
.png)
.png)